| Newbie needs help with PDT 3.2.0/XDebug/Chrome [message #1798805] |
Sun, 25 November 2018 22:13  |
 Dan Morton Dan Morton
Messages: 2
Registered: November 2018 |
Junior Member |
|
|
I currently use PHPStorm to debug a phpBB Board, but my (free) academic license is about to expire, and I'm looking for a free alternative. I'm checking out Eclipse PDT, but the behavior seems different.
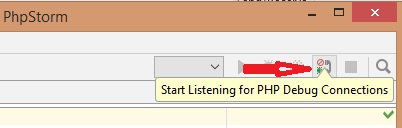
In PHPStorm, I can set breakpoints and then enable debugging by clicking the debug icon as shown here:
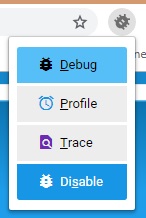
I can then launch Chrome, navigate to my site, and choose "Debug" from the Chrome XDebug plug-in as shown ihere:
Then as I operate my website in Chrome and encounter the breakpoint, PHPStorm comes to the fore and permits me to examine variables.
I believe I have set XDebug as my debug agent in PDT, but I don't encounter breakpoints I have set as I navigate my site in Chrome. I think I may have hit breakpoints using the internal browser, but I can't seem to reproduce it reliably - and, I would really like to operate the browser independent of PDT, as I did with PHPStorm. Is it possible, and is it simply the case that I may have misconfigured PDT for debugging? And leads would be much appreciated.
Thanks
Dan
 Attachment: PHPStorm.jpg
(Size: 15.21KB, Downloaded 431 times)-
Attachment: Chrome.jpg
(Size: 12.26KB, Downloaded 402 times)
|
|
|
|
|
|
Powered by
FUDForum. Page generated in 0.01435 seconds
") ]
]  Search
 Help
Help Register
 Login
Login Home
Home


